Using SOLT to augment the keypoints (landmarks)
In this tutorial, we will shortly demonstrate how to use SOLT with the landmarks data. For that, we will use the Helen dataset: http://www.ifp.illinois.edu/~vuongle2/helen/
To run this notebook, please download annotations and test images, and place them into Data/helen_annotations and Data/helen_test_images respectively.
[4]:
%matplotlib inline
import numpy as np
import matplotlib.pyplot as plt
from matplotlib import patches
import cv2
import os
import glob
import json

np.random.seed(12345)
[5]:
import solt
import solt.transforms as slt
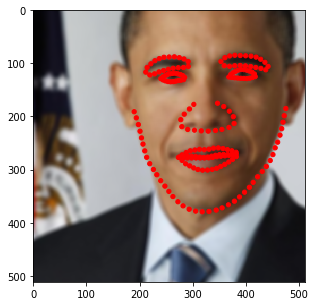
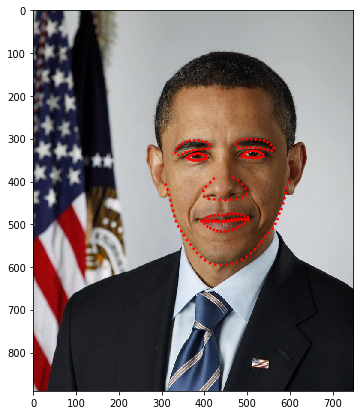
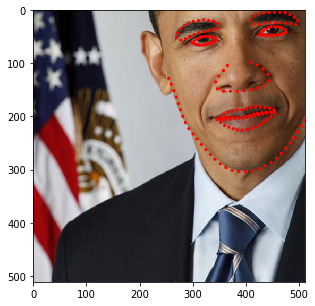
Loading and visualizing the image
[6]:
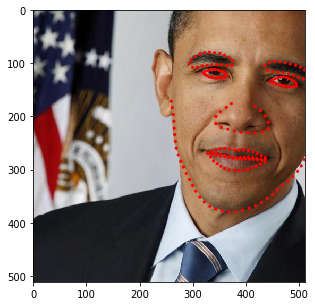
fname = '3238436027_1.jpg' # Let's just work with this particular image
img = cv2.imread(os.path.join('Data', 'helen_test_images', fname))
img = cv2.cvtColor(img, cv2.COLOR_BGR2RGB)
[7]:
kpts = None
for annotation_fname in glob.glob(os.path.join('Data', 'helen_annotations', '*.txt')):
    with open(annotation_fname) as f:
        if f.readline()[:-1] == fname.split('.')[0]:
            ktps = []
            for l in f:
                tmp = l.split()
                ktps.append([float(tmp[0]), float(tmp[2])])
            break
kpts = np.array(ktps)
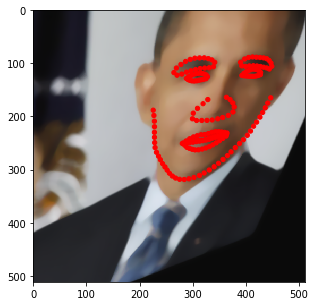
[8]:
fig = plt.figure(figsize=(7, 7))
ax = fig.add_subplot(1,1,1)
ax.imshow(img)
for k in kpts:
    ax.add_patch(patches.Circle(k, radius=2, color='r'))
plt.show()
Wrapping the data into SOLT format
[10]:
# Let's first wrap our keypoints into a keypoints container
kpts_wrapped = solt.Keypoints(kpts, img.shape[0], img.shape[1])
# Then, we should wrap the image and the created keypoints into a DataContainer
dc = solt.DataContainer((img, kpts_wrapped), 'IP')
Defining a simple stream and testing it
[14]:
stream = solt.Stream([
    slt.Rotate(angle_range=(-20, 20), p=1),
    slt.Crop(512, crop_mode='r')
])
print(stream.to_yaml())
stream:
  interpolation: null
  optimize_stack: false
  padding: null
  transforms:
  - rotate:
      angle_range:
      - -20
      - 20
      ignore_state: true
      interpolation:
      - bilinear
      - inherit
      p: 1
      padding:
      - z
      - inherit
  - crop:
      crop_mode: r
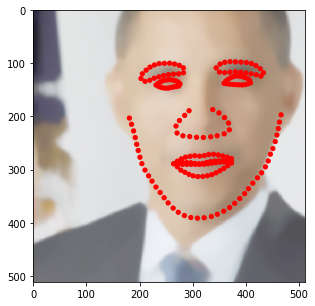
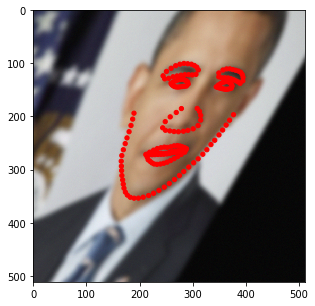
[15]:
for i in range(10):
    res = stream(dc, return_torch=False)
    img_res, kp_res = res.data

    fig = plt.figure(figsize=(5, 5))
    ax = fig.add_subplot(1,1,1)
    ax.imshow(img_res)
    for k in kp_res.data:
        ax.add_patch(patches.Circle(k, radius=2, color='r'))
    plt.show()
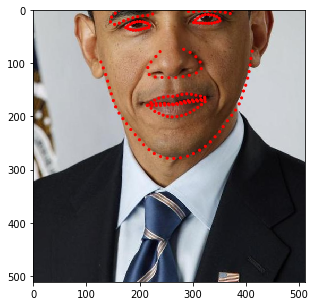
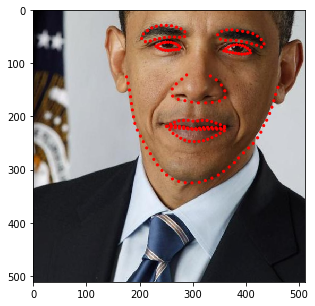
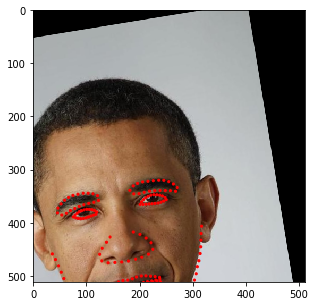
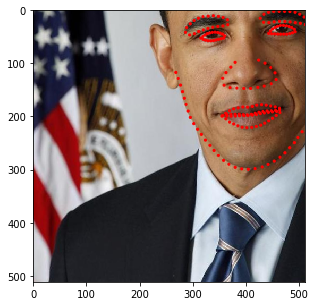
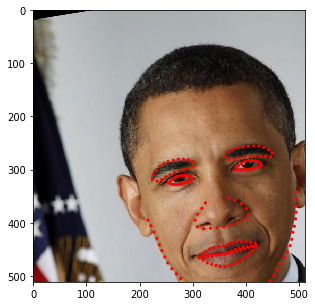
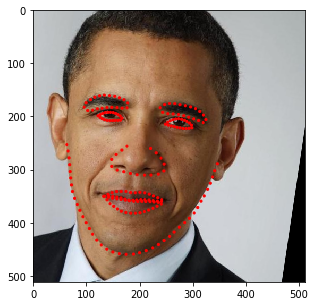
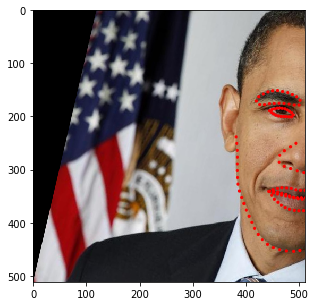
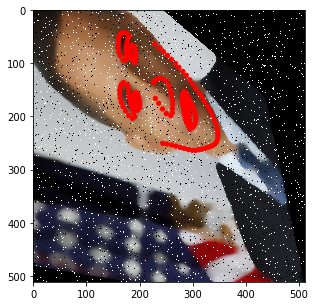
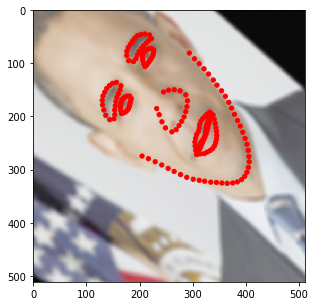
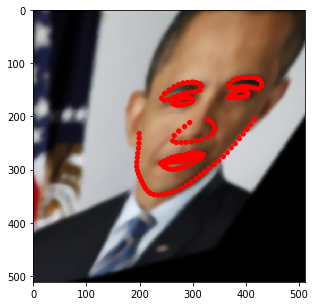
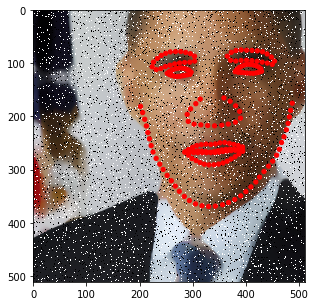
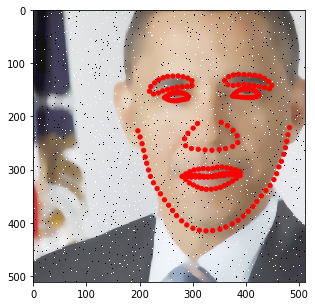
You may have noticed that the image size changes depending on the rotation angle. In fact, at this stage, we incorporated such behavior into SOLT. Let’s now define a more complicated pipeline.
[17]:
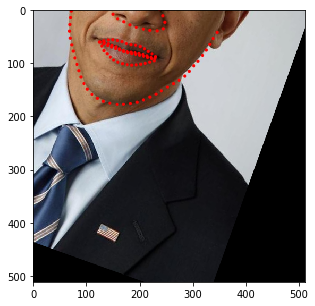
stream = solt.Stream([
    slt.Projection(
            solt.Stream([
                slt.Scale(range_x=(0.5, 1.3), p=1),
                slt.Rotate(angle_range=(-90, 90), p=1),
                slt.Shear(range_x=(-0.5, 0.5), range_y=None, p=1),
        ]),
        v_range=(1e-6, 9e-4)),
    slt.GammaCorrection(p=0.5, gamma_range=(0.5, 3)),
    solt.SelectiveStream([
        slt.Blur(p=0.5, blur_type='g', k_size=(11, 21, 31), gaussian_sigma=(1, 10)),
        slt.Blur(p=0.5, blur_type='m', k_size=(11, 21, 31)),
    ]),
    solt.SelectiveStream([
        slt.SaltAndPepper(p=1),
        slt.Noise(p=1)
    ]),
    solt.SelectiveStream([
        slt.Blur(p=0.5, blur_type='g', k_size=(11, 21, 31), gaussian_sigma=(1, 10)),
        slt.Blur(p=0.5, blur_type='m', k_size=(11, 21, 31)),
    ]),
    slt.Pad(600, 'z'),
    slt.Crop(600, crop_mode='c'),
    slt.Crop(512, crop_mode='r')

])
print(stream.to_yaml())
stream:
  interpolation: null
  optimize_stack: false
  padding: null
  transforms:
  - projection:
      affine_transforms:
        stream:
          interpolation: null
          optimize_stack: false
          padding: null
          transforms:
          - scale:
              ignore_state: true
              interpolation:
              - bilinear
              - inherit
              p: 1
              range_x:
              - 0.5
              - 1.3
              range_y: null
              same: true
          - rotate:
              angle_range:
              - -90
              - 90
              ignore_state: true
              interpolation:
              - bilinear
              - inherit
              p: 1
              padding:
              - z
              - inherit
          - shear:
              ignore_state: true
              interpolation:
              - bilinear
              - inherit
              p: 1
              padding:
              - z
              - inherit
              range_x:
              - -0.5
              - 0.5
              range_y:
              - 0
              - 0
      ignore_state: true
      interpolation:
      - bilinear
      - inherit
      p: 0.5
      padding:
      - z
      - inherit
  - gamma_correction:
      data_indices: null
      gamma_range:
      - 0.5
      - 3
      p: 0.5
  - stream:
      n: 1
      optimize_stack: false
      probs: null
      transforms:
      - blur:
          data_indices: null
          gaussian_sigma: &id002
          - 1
          - 10
          k_size: &id001
          - 11
          - 21
          - 31
          p: 0.5
      - blur:
          data_indices: null
          gaussian_sigma: &id003
          - 1
          - 1
          k_size: *id001
          p: 0.5
  - stream:
      n: 1
      optimize_stack: false
      probs: null
      transforms:
      - salt_and_pepper:
          data_indices: null
          gain_range:
          - 0
          - 0.1
          p: 1
          salt_p:
          - 0.5
          - 0.5
      - noise:
          data_indices: null
          gain_range:
          - 0
          - 0.1
          p: 1
  - stream:
      n: 1
      optimize_stack: false
      probs: null
      transforms:
      - blur:
          data_indices: null
          gaussian_sigma: *id002
          k_size: *id001
          p: 0.5
      - blur:
          data_indices: null
          gaussian_sigma: *id003
          k_size: *id001
          p: 0.5
  - pad:
      pad_to:
      - 600
      - 600
      padding:
      - z
      - inherit
  - crop:
      crop_mode: c
  - crop:
      crop_mode: r
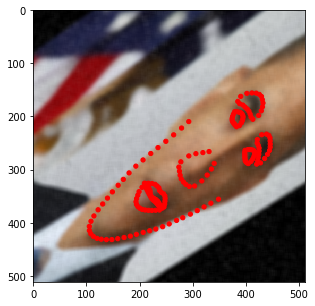
[18]:
for i in range(10):
    res = stream(dc, return_torch=False)
    img_res, kp_res = res.data

    fig = plt.figure(figsize=(5, 5))
    ax = fig.add_subplot(1,1,1)
    ax.imshow(img_res)
    for k in kp_res.data:
        ax.add_patch(patches.Circle(k, radius=4, color='r'))
    plt.show()